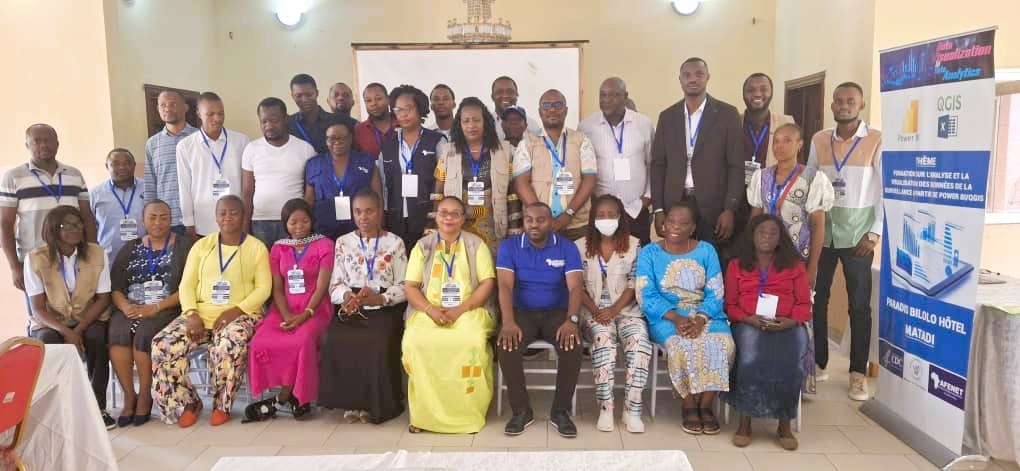
Twenty-seven officers from five different departments of the Ministry of Health in the Democratic Republic of Congo (DRC) were recently equipped with skills on analysis and visualization of data.
This follows a training workshop organized by the DRC Field Epidemiology Training Program from March 31 through April 7, 2025, in Kinsasha.
All but two trainees were drawn from Epidemiological Surveillance Department (DSE), National Institute for Biological Research (INRB), National Health Information System Directorate (DSNIS), Expanded Vaccination Program (EPI), and Public Health Emergency Operations Center (COUSP).
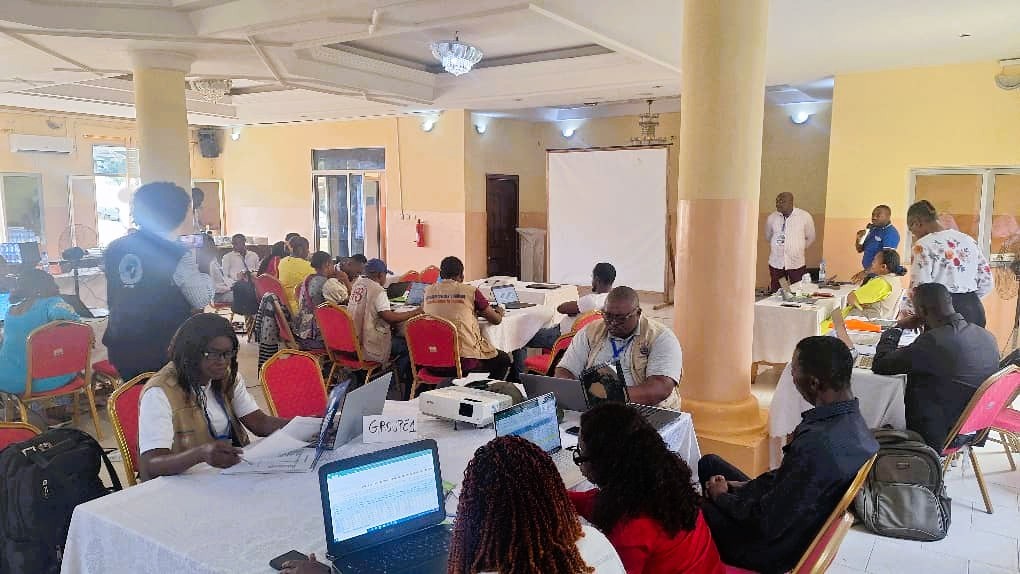
During the training, participants were equipped with skills to:
- Perform duplicate searches on aggregated databases and on case-by-case databases.
- Synthesize the data aggregated by province or health zone according to different degrees of disaggregation and calculate the indicators using the basic formulas;
- Synthesize the samples of suspected cases taken by the health zone and by epidemiological week;
- Synthesize Igm + Measles/Rubella by health zone and by epidemiological week, and determine the list of health zone confirmed measles/Rubella epidemics;
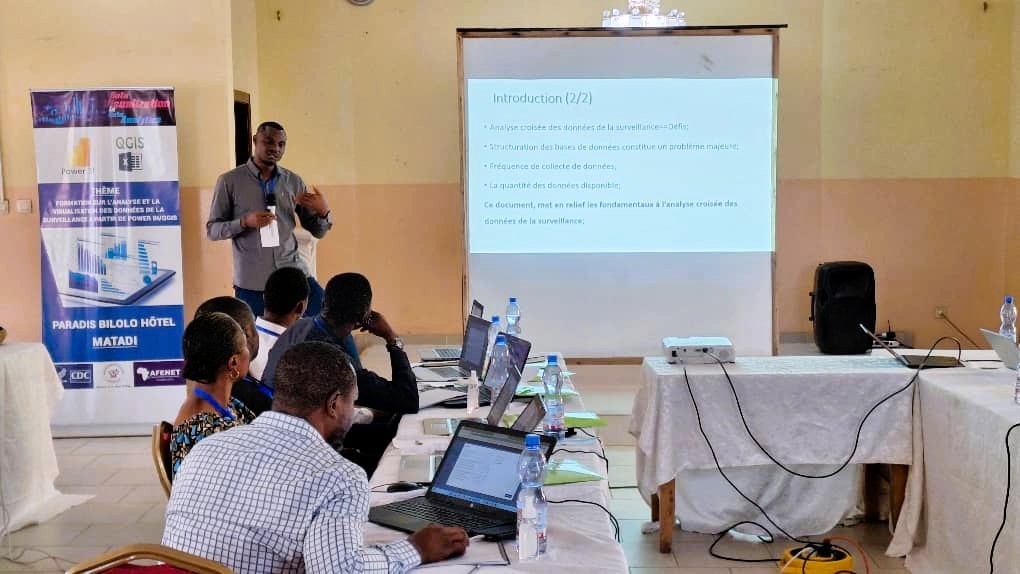
In addition, the trained staff are all able to map monitoring data from QGIS, and can do
data modeling from Power BI and creating data visualization models on Power BI.
Quantum Geographic Information System (QGIS) software that supports viewing, editing, printing, and analysis of geospatial data in a range of data formats. Whereas Power BI is a unified, scalable platform for self-service and enterprise business intelligence (BI). Connect to and visualize any data.
Analysis and visualization of surveillance data are essential for proactive public health management, and enables timely detection of threats, informed decision-making, and effective interventions to protect public health.
AFENET